Data Computing Visualization Platform for Ernst & Young

Complex web platform for initiating calculations and seeing results, reports and charts
Industry
Financial
Project Type
Web Platform
Main technology
PHP,
Vue
Collaboration type
Product Development
People involved
4
Hours worked
700+
Country
Romania
ey logo vector 2

Client

Ernst & Young Global Limited, trade name EY, is a British multinational professional services partnership.

EY is one of the largest professional services networks in the world. Along with Deloitte, KPMG and PwC, it is considered one of the Big Four accounting firms. It primarily provides assurance, tax, information technology services (including managed services in areas like Cybersecurity, Cloud, Digital Transformation and AI), consulting, and advisory services to its clients.

Solution Summary

The solution we developed is a web interface responsible to run, monitor and view output of specific existing Python scripts.

Solution Summary
Components

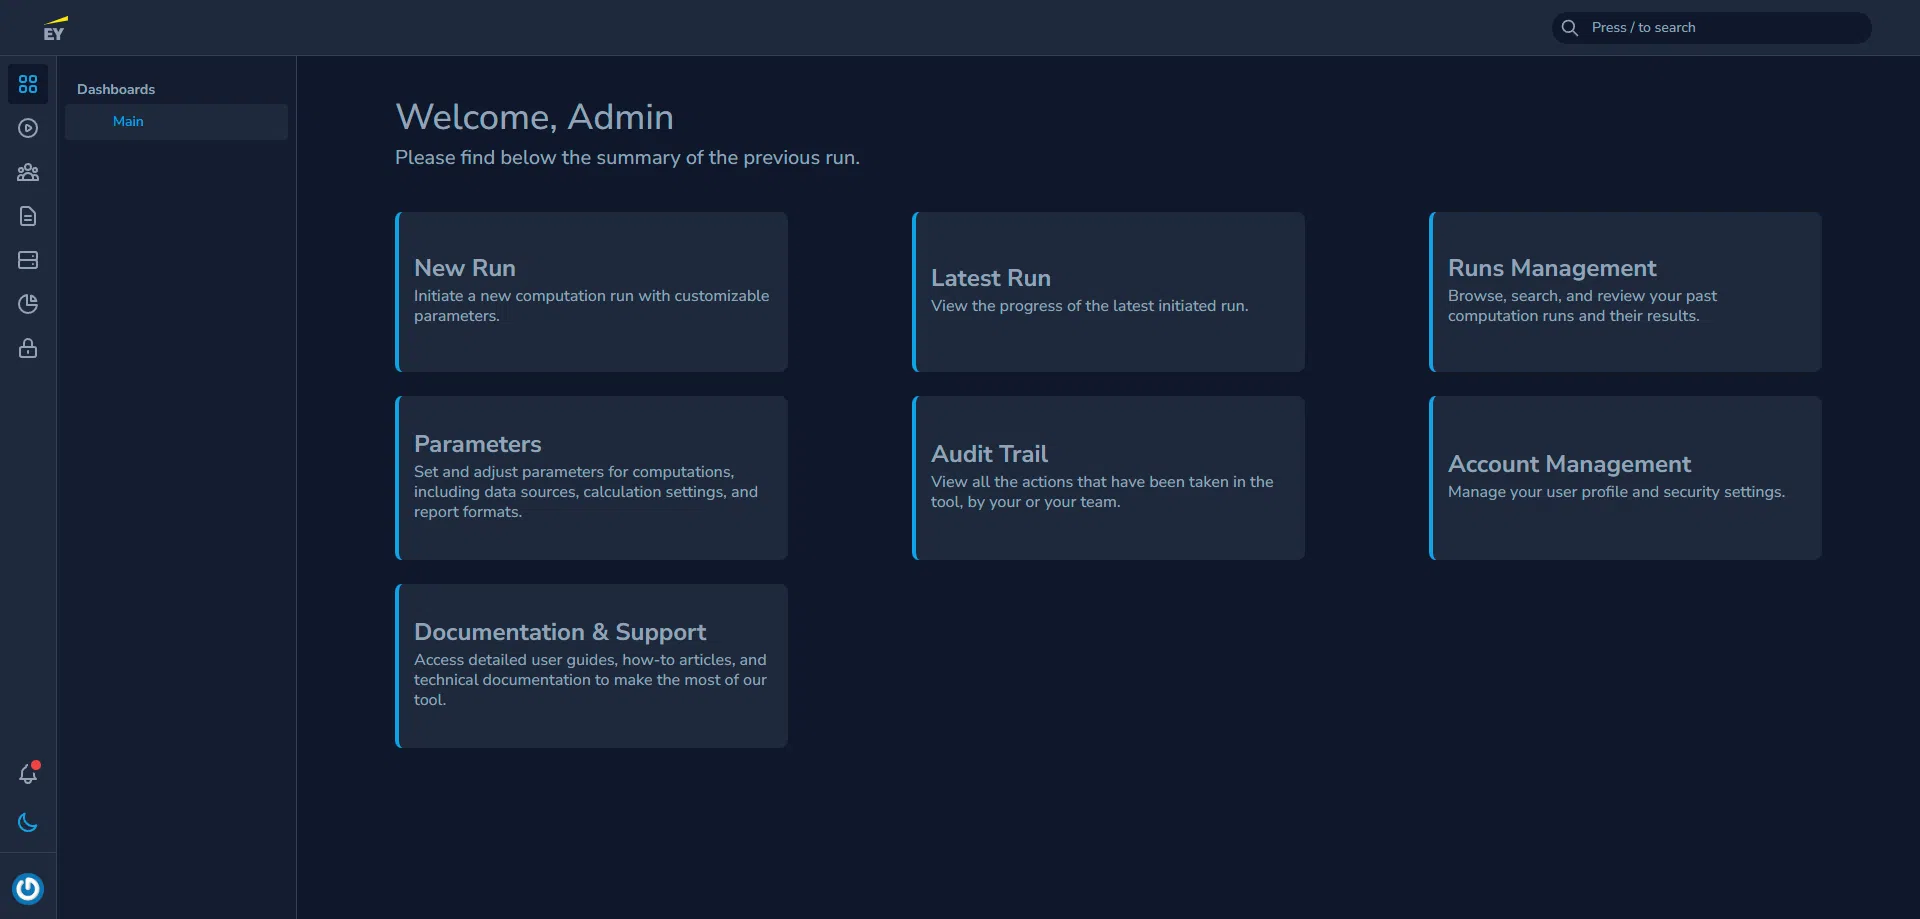
There are 5 main areas the solution is built on

Run Management
Start a new run, view progress and status, browse existing runs, search, and review past computation runs and their results. Everything in a modern and easy to use graphic web interface.
Parametrisation of Run Setup
Each run has a set of parameters. The solution allows the user to set and adjust these parameters for computations, including data sources, calculation settings, and report formats.
Audit Trail
View all the actions that have been taken in the tool, by the team. Every action made in the platform is logged and can be traced back in an easy manner.
Account Management
Manage user profiles, roles and security settings for each role. The platform can be accesed by multiple users at the same time. Users are assigned to a role and each role has a set of access permissions, making the solution to be very versatile in terms of access rights configuration.
Reporting and Charts
Visualize run results and create custom charts based on output data. This is the most spectacular part of the web interface beacuase it allows users to create custom charts and reports, very similar to a classic BI solution.
How We Worked

It all started with an initial meeting in which we discussed and understood de requirements of the web interface they wanted to build.

We came back with a few variants of solutions and architectures and after a couple of iterations we agreed on the final form.

After that, the development team was formed and coding started.

Three developers were assigned full on the project, and together with a Project Manager and a QA moved forward in an Agile manner.

After a few sprints we had a first version of the solution, ready to be tested by the client.

Soon after a few changes and feedback sessions, the final version was ready to be deployed and launched.

The implementation and the collaboration were a succes and after a short period of time the same team started a new project for the same client.

Services
Back-office Applications
Custom Software
Custom Web Applications
Manual Testing
Technologies
PHP
Laravel
MySQL
Github
Laravel Nova
Client Review
Other Case Studies